


Big Box Retail & Malls
Collecting data from shopping malls is not a new concept or idea. In fact, if you ask most mall owners, they will likely be able to tell you statistics on revenue, rent per square foot, as well as building utility and maintenance costs. While this is very important data that every mall owner should know, this data isn’t particularly helpful when it comes to thinking about what kinds of stores to recruit for vacant spaces, which stores benefit from being clustered together, or how mall layouts can be optimized to increase footfall and visitor traffic. Data visualization tools can help malls uncover all data they’ve been neglecting. Data visualization for retail malls is revolutionizing the way mall owners and retailers understand shopping mall foot traffic statistics and store performance.
By transforming shopping mall data collection into visual insights, mall operators can unlock smarter decisions about layout, promotions and tenant mix. With cutting-edge tools like indoor mapping and heat mapping, shopping mall analytics now empower stakeholders to boost engagement and increase footfall in shopping malls. These tools not only optimize leasing strategies but also uncover new revenue opportunities. In 2025, mastering data visualisation & retail analytics will be essential for retail centres looking to stay competitive in a changing landscape.
For the relatively few mall owners who do choose to collect more data about their mall, the collection of this additional data typically requires a third-party operating team. This third-party team gathers the required information and prepares reports on a monthly basis. These reports can require as much as ten man-days each month, as operators physically visit each site, collect store-level data, and determine the best way to merge the two. The end result is a series of hair-pulling Excel spreadsheets or colorful graphs, which present the data but don’t make it very accessible.


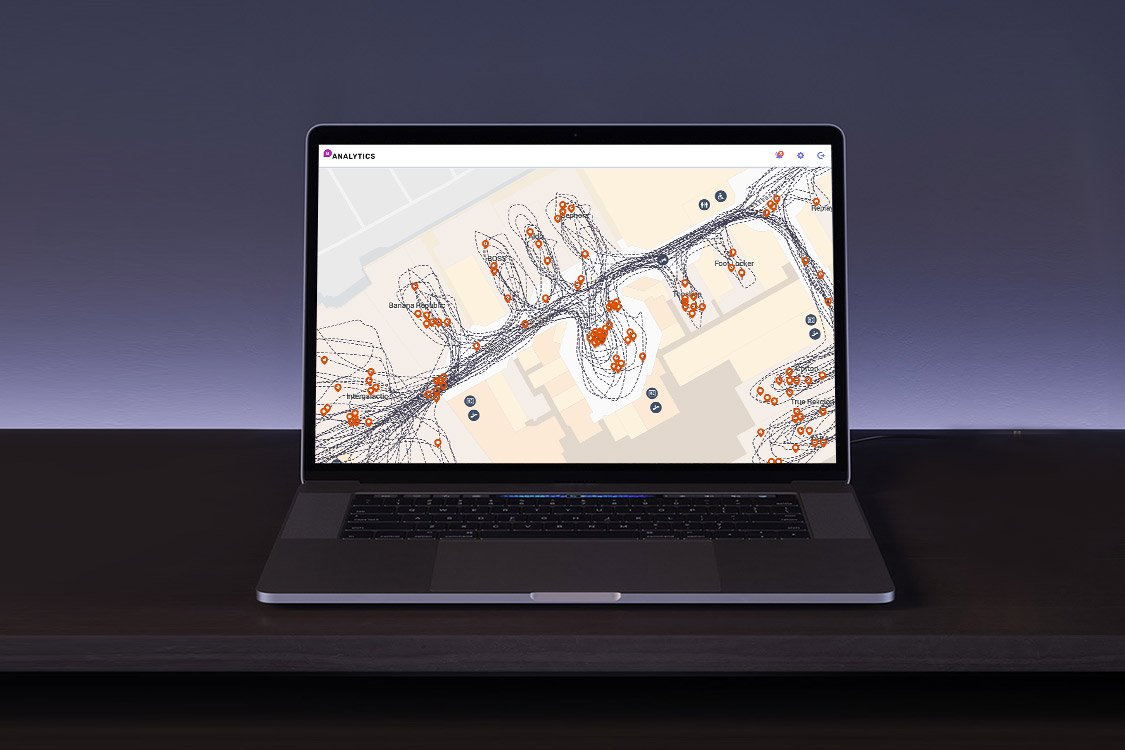
Mall owners who are used to viewing dozens of rows and columns of numbers may be surprised to find out that their lack of visualization tools is causing them to leave money on the table. The ability to view relevant mall data over site-specific indoor maps can help owners and their sales teams identify patterns and increase revenue.
Stand-Alone Retail Stores Are Already Using This Technology
Major stand-alone retail locations have long been focused on store design, customer experience, and increasing revenue per visit, but now even the smallest shops are getting involved with the trend. These retailers are constantly analyzing their data and reviewing footfall patterns to determine store layout, which promotions best pair together, and how to use the physical space to convey their brand attributes. Because of the flexibility of their indoor space, layout, and floor design are a fundamental part of their success equation. Stand-alone retailers know better than anyone how moving one department to another area of a store or changing up the displays at the front entrance can increase or decrease customer engagement and sales.
Increase Revenue with Data Visualization Insights
Although shopping malls have much less flexibility when it comes to moving stores from one area to another, map-based visualization can still be equally important. Malls have the opportunity to compare separate store insights to provide a better picture of which combinations provide the most overall benefit for the shopping center. Here are some examples of the opportunities indoor map-based data visualization can provide.
Reduced Vacancy
Keeping store space rented isn’t important just for the mall owners. It is of equal value to the other stores in the shopping center. Having a space sit empty for an extended period not only looks bad to shoppers, it can also lead to a reduction in foot traffic. As the sales team looks at contract end dates and prepares for upcoming vacancies, they can benefit from having the right tools to show prospects which shops and stalls are available and the metrics of the other stores in the vicinity. Having a visual view of the data overlaid on an indoor map can help the sales team command the best possible rental price for each space.
Drive Footfall and Overall Profitability
While each shop in the mall will worry about its own foot traffic, it is of critical importance to the mall owners that no area in the mall is left behind. If traffic drops in one area, it can lead to an unintended erosion in rent prices. Malls have a variety of options to push customers into specific areas of the shopping center, including tools like multi-store coupons, advertising highlighting specific stores or amenities, or adding some attractive brands in key spaces.
Although this center-wide foot traffic data is typically available, not having the right representation to view it is usually the bottleneck. By combining the power of data representation tools like Mapsted Analyze over an indoor map, the insights are much easier to identify.
Create New Revenue Streams
Seasonal displays, special event spaces, and temporary stalls all offer shopping centers additional opportunities for revenue. The challenge is to determine the best placement for these floating display areas. Data visualization over an indoor map can make this task easier, by helping to identify low foot traffic zones which could use a lift or which stores might best complement the display.
Frequently Asked Questions
Q1. Why do malls need data visualization?
Ans. Malls are struggling to make pre-COVID-19 revenues. Mall owners are dissatisfied with higher vacancies and low foot traffic. Data visualization can help in a variety of ways, from optimizing rent and directing people to specific areas to creating the right representation for stores to boost sales.
Q2. What can data visualization show?
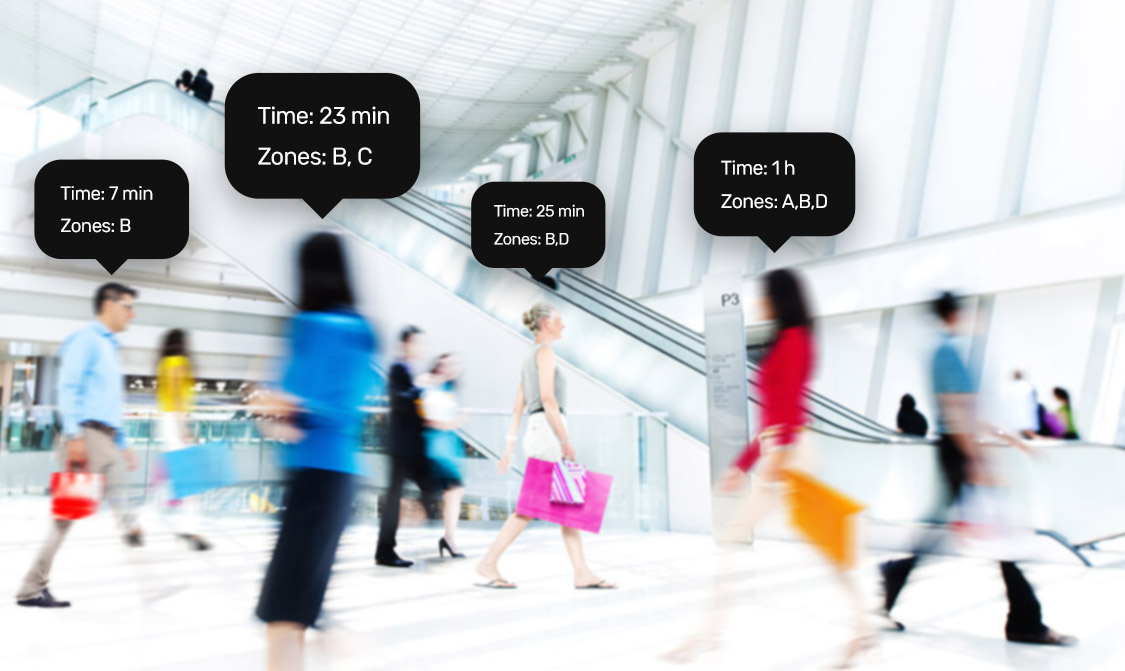
Ans. Smart analytics using data visualization methods show where traffic is congregating in real-time and investigate patterns of people movement, occupancy rates in specific areas, and rent trends.
Q3. Does a mall need additional infrastructure for data visualization?
Ans. It was previously difficult to visualize data without deploying infrastructure, but Mapsted has eliminated the need for any hardware on-premises by using data collected from the user’s device after thorough consent. The data enrich insights, allowing for quick decisions.
Q4: How is data visualization transforming retail malls?
A: Data visualization for retail malls allows owners to see dynamic foot traffic patterns, evaluate store performance and make informed leasing decisions. This helps drive revenue and improve customer experiences using real-time insights and shopping mall analytics.
Q5. What kind of data is collected in shopping malls today?
Ans. Modern shopping mall data collection includes foot traffic counts, heat maps, store dwell time and transaction data. Combined, these datasets form a comprehensive shopping center data system to boost tenant success and attract new customers.
Q6. Can data visualization help increase footfall in malls?
Ans. Yes. Tools that combine shopping mall foot traffic statistics with indoor maps help identify low-traffic zones. Mall owners can then implement promotions, redesign layouts or add attractions in those zones—answering the question of how to increase footfall in shopping malls effectively.
Q7. How does retail store visualization benefit mall tenants?
Ans. Retail store visualization enables tenants to track customer movement, optimize product placement and align marketing with customer behaviour. These insights can improve conversion rates and store profitability.
Q8. Do malls need special infrastructure to implement analytics?
Ans. Not anymore. Innovative platforms like Mapsted eliminate the need for Wi-Fi, Bluetooth or beacons. Mall owners can now use consent-based, device-generated data for shopping mall analytics and data visualisation & retail analytics—without major infrastructure investments.


