


Technology Trends

Mapsted’s cutting-edge location-based analytics melds geographic data with operational insights, unveiling potent solutions to your business challenges. By seamlessly integrating Mapsted’s hardware-free technology into your existing systems, you can enhance traditional business analytics tools like BI, CRM, ERP, EAM, and productivity platforms such as Microsoft Office and Google Sheets.
Many businesses overlook the depth of value that location analytics can provide, mistaking it for merely plotting data points on a map. The truth is, it’s far more profound. Our three location analytics imperatives guide you to unleash the full potential:
1. Expand Your Perspective: Unravel Geographic Insights
Move beyond internal data; enrich your business perspective with geographic insights. Understand the demographics, competitive businesses, customer behaviour and more. Geo-enrichment adds layers of invaluable information, enhancing your understanding of your market and refining your strategies.


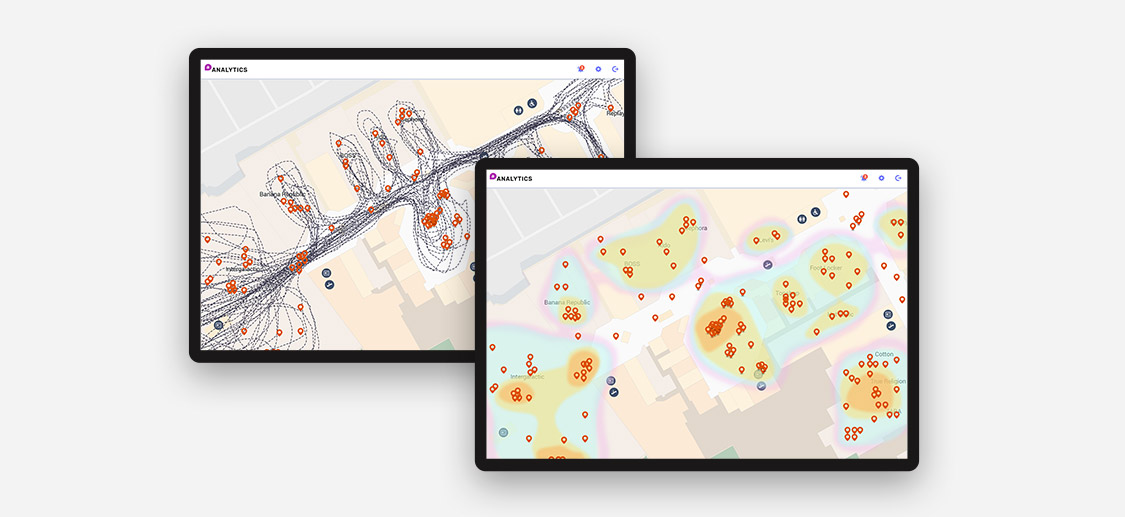
2. Elevate Your Mapping Game: Beyond Dots on Maps
Basic mapping won’t suffice for extensive data volumes. Mapsted’s analytics platform offers advanced tools such as clustering, heat maps and segmentation, ensuring your data’s clarity and accessibility. Avoid the clutter of multiple data points; instead, reveal insights with precision.
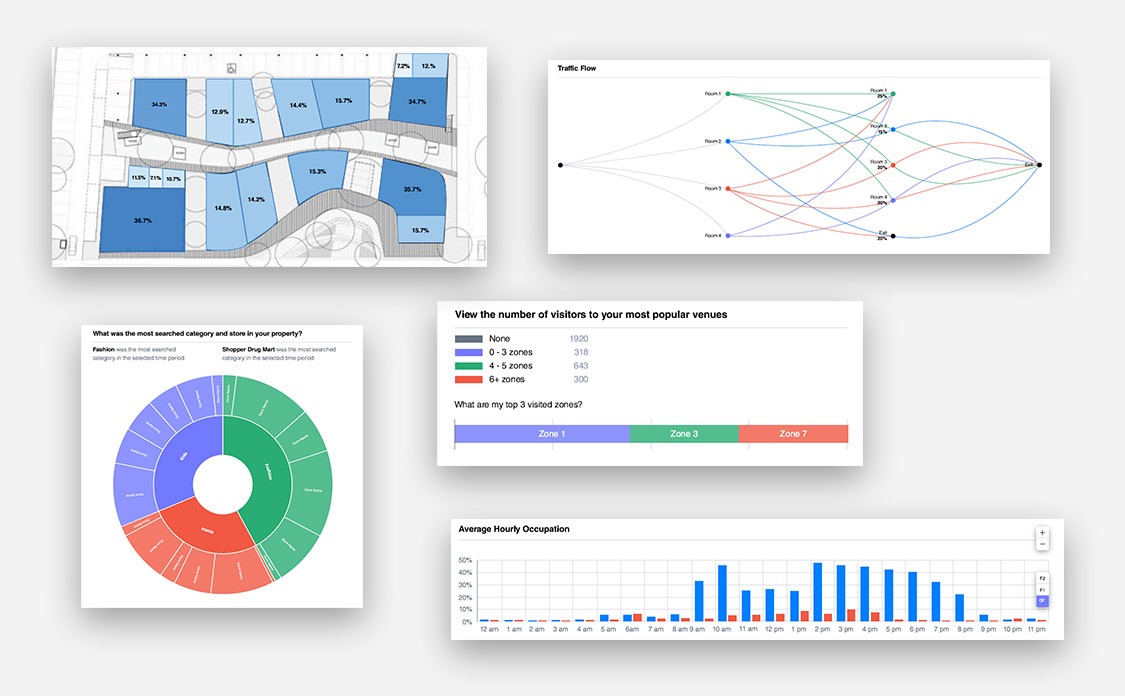
3. Master Map-Driven Analysis: Unlock Hidden Patterns
Maps are not just visual aids; they’re powerful analytical tools. With Mapsted, connect your data seamlessly to maps. Interrogate it with spatial queries, delve into hot spot analysis, and employ spatial modeling. Predict performance, identify outliers, and validate data quality – all from a spatial perspective.
Conclusion: Transform Your Insights, Transform Your Business
To maximize your data’s value, embrace Mapsted’s three location-based analytics imperatives: expand your overview, delve deeper than basic mapping, and perform map-driven analysis. Backed by our 24/7 support, Mapsted’s location-based analytics and Maps platform empower your business to thrive, one strategic location insight at a time.
If you enjoyed learning a bit about the potential benefits of location-based analytic for your business, you may want to check out our blog on What is Location Intelligence Technology and How Can It Help You Grow Your Business? and our short video on how to Empower Your Business With Advanced Location-Based Analytics Solutions.
Frequently Asked Questions
Q1. What are location-based analytics?
Ans. Consider location analytics to be a geographical layer that provides context to your business. Realistically, it provides real-time insights into what visitors are doing and how you can influence their behavior through targeted advertising and geofencing.
Q2. Why do businesses need location-based analytics?
Ans. Every time a visitor browses the kiosk or enters a search query into their IPS app, it generates data points for indoor analytics. The data can be transactional, navigational, or informational, and it provides a new context for user behaviors and intentions.
Q3. What are ways in which you can use indoor maps in Mapsted?
Ans. Key features of indoor maps that contribute to their success:
- You can get access to cool indoor map themes
- A 3D map depicting the location of stores
- Custom maps for event tracking and management
- Indoor search is simple to use.
- Indoor routing that is effective
Q4. What does location analytics software do?
Ans. Location analytics software will track people’s engagement, asset positions, and infrastructure utilization to ensure that the organization overcomes business challenges and optimizes operations for increased customer engagement.
Q5. What is a location-based database?
Ans. If you want to know your customers’ behavior or where they spend the most time, you can use a comprehensive solution. A database based on location. This is a compiled report that summarises behavior while shopping, window shopping, or traveling from one location to another.


