


Museums & Galleries

With the cultural sector continuously evolving, museums are using data to understand visitors in addition to attracting and retaining audiences like never before. As a result, museums use AI, electronic tracking and innovative solutions like Mapsted’s Interactive Maps and Location Analytics Technology to learn about visitor demographics, preferences and behaviours. Also, data-driven findings optimize exhibit layouts, tailor programs and engage guests, bringing culture and technology together in 2025. So, here’s a quick guide on how museums use data to understand visitors and prepare for the future of visitor engagement.
Modern museum management relies on visitor analytics to measure dwell time, peak hours and popular exhibits. As a result, these insights direct museums toward visitor-centric operations and strong audience engagement.
A. The Rise of Museum Visitor Analytics
In 2024, 33% of US adults visited a museum, surpassing pre-pandemic levels. Also, a 2024 study found that industry attention spans an average of 8.25 seconds, highlighting the need for interactive and data-driven experiences. Moreover, this also indicates a growing trend of museum visitors seeking more interactive and technology-driven experiences.
In 2024, 33% of US adults visited a museum, surpassing pre-pandemic levels. A 2024 study found that industry attention spans an average of 8.25 seconds, highlighting the need for interactive and data-driven experiences.
Technological Advancements in Museums
- AI & Chatbots: Institutions like the Centre Pompidou use AI-powered chatbots for real-time visitor guidance.
- AI-Driven Collections: The Smithsonian uses AI to transcribe historical documents for public access. Also, the National Museum of the Royal Navy and Southampton University develop AI image classification tools to improve archive management.
- AI for Curation: The Nasher Museum of Art experimented with ChatGPT to select artworks by thematic connection, offering fresh perspectives on curation.
- Seamless Technologies: Smart glasses, augmented reality and other immersive tools give visitors interactive insights. For instance, seeing how a painting originally looked centuries ago is now possible.
These innovations are partly driven by research-centric gatherings like Museum Big Data (MBD) conferences, where academics and practitioners exchange cutting-edge ideas on data analytics. Meanwhile, Mapsted’s Location Analytics provides real-time dashboards and heat maps helping with immediate and longer-term strategic decisions.
How Mapsted Helps
- Real-Time Analytics: Collects live data to visualize visitor movement and visitor behaviour patterns in museums.
- Interactive Maps: Provides smooth navigation for guests, improving satisfaction and reducing confusion.
Hence, using AI and location data to power museum visitor analytics helps museums quickly adapt to changing visitor habits.
B. Leveraging Data Analytics for Museums
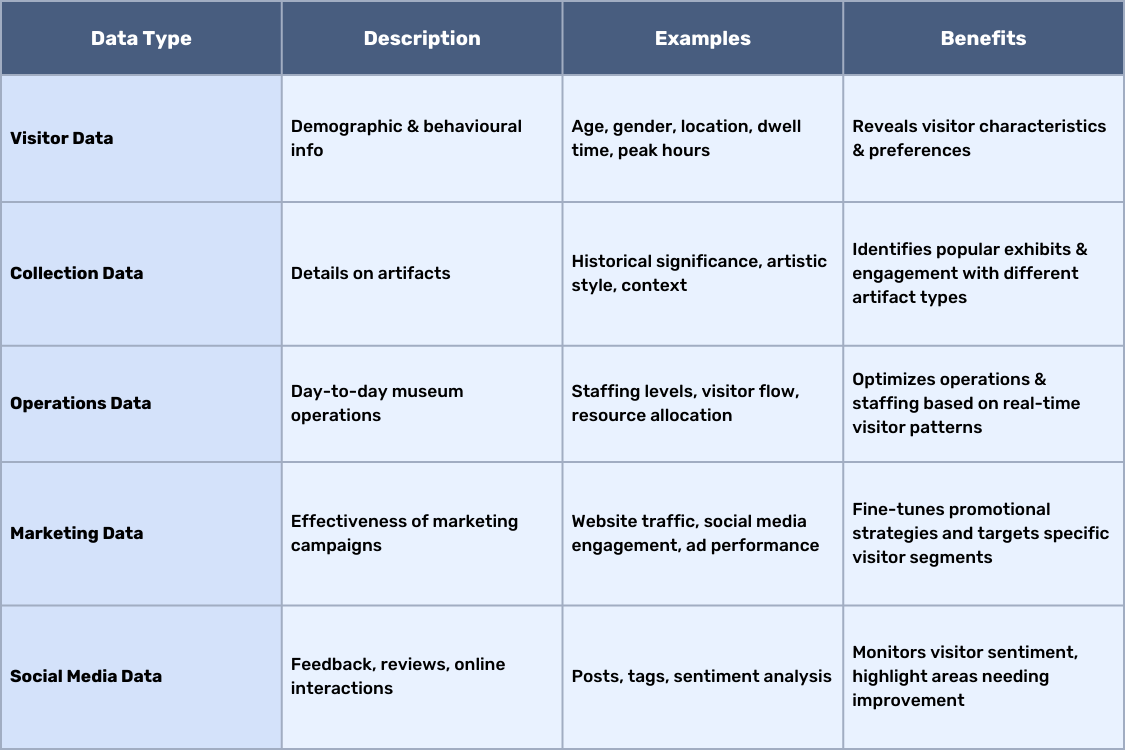
Data analytics for museums is more than just keeping track of visitors; it also combines information from marketing, operations and exhibit-specific data to find new insights. This all-around approach helps show how outside campaigns affect turnout and whether certain displays interest a certain group of people.
How Can Mapsted Help
Mapsted’s IoT Flow Heat Mapping identifies high-traffic zones, allowing museums to optimize exhibit placement and reduce congestion. In addition to advanced analytics techniques—like clustering (grouping visitors by similar behaviours), regression analysis (predicting future attendance trends) and sentiment analysis (assessing visitor satisfaction)—museums gain a powerful toolkit for decision-making.
Annual Survey of Museum-Goers
- The AAM and Wilkening Consulting’s 2024 Annual Survey of Museum-Goers found that visitors highly value imaginative learning experiences. For example, reading and nature were the top factors sparking creativity, underscoring how diverse stimuli attract audiences.
- Discussions like “Future Chat: Diving into Museum Data” further highlighted the importance of demographic-specific insights.
Key Features of Mapsted IoT Flow
- Real-Time Heat Mapping: Tracks movement patterns to minimize bottlenecks.
- Privacy-Focused Solutions: GDPR-compliant design ensures ethical data use.
By combining these skills with advanced AI forecasting models, it is also possible to guess the number of visitors, which helps organizations plan their staffing and use their resources well.
C. Exploring Visitor Pattern Analysis and Flow Tracking
Visitor pattern analysis shows which exhibits draw visitors and how they navigate the museum. As a result, museums can identify dwell times and frequent routes using Wi-Fi, Bluetooth or AI. This fits the Data Collection in Museums framework:
Hence, with such a structured approach museums capture only what’s necessary—respecting privacy and applying data minimization principles.
Also, museum staff can manage exhibit assets in real-time with Mapsted’s IoT Tags, which improve visitor flow tracking. Then, curators and operations teams use this real-time data to adjust layouts or exhibits as traffic changes.
Mapsted IoT Solutions for Museums
- Asset Tags: Track exhibit pieces to avoid misplacements.
- Flow Analytics: Use movement trends to refine layouts and streamline operations.
D. Gaining Museum Visitor Insights for Personalized Experiences
Deep museum visitor insights form the backbone of personalized interactions. So, by combining membership program data, surveys and feedback from social media, museums can tailor experiences for specific age groups or interests. For instance, families might appreciate a guided scavenger hunt, while art connoisseurs crave behind-the-scenes talks or curator-led tours.
Key AI Applications
- Predictive Analytics: AI uses historical attendance and exhibition schedules to forecast visitor numbers.
- Clustering & Regression: Identify patterns around demographics to refine exhibit planning and scheduling.
This is where Mapsted’s Location Marketing Technology really shines. Firstly, it sends guests proximity-based alerts about upcoming events or new discounts. Secondly, using geofencing, museums can tell people who are close to a certain gallery to check out a related workshop. As a result, this keeps people interested without being intrusive.
Mapsted’s Advantages
- Proximity Marketing: Sends alerts about nearby exhibits or special events.
- Inclusive Design: Multilingual guides, accessible features and personalized notifications accommodate diverse audiences.
E. Using Data Analytics to Improve Museum Experiences
By using data analytics, museums can adjust exhibit design, staffing schedules and marketing strategies to meet real-time needs. For example, Microsoft helped the British Museum analyze routes and dwell times, improving visitor flow and exhibit layouts.
For example, Microsoft helped the British Museum analyze routes and dwell times, improving visitor flow and exhibit layouts.
Mapsted’s Badge Personnel Monitoring also streamlines operations by tracking staff movement. During peak hours predicted by AI modelling, more staff can be positioned at popular exhibits or high-traffic zones, improving the overall visitor experience.
Case Studies of Museums Using Data Analytics
- The Louvre Museum: Louvre Museum Used anonymized Bluetooth sensor data to discover congestion points and improve visitor routing.
- The Douro Museum: Douro Museum Analyzed online search data to refine offerings and boost marketing effectiveness.
- The Smithsonian Institution: Smithsonian Institution Employs AI to transcribe historical documents, greatly expanding the accessibility of its archives.
Mapsted’s Comprehensive Solutions
- Badges for Staff Monitoring: Enhances accountability and operational efficiency.
- Predictive Analytics: Forecasts attendance surges to allocate resources optimally.
When museums combine these strategies—bolstered by advanced analytics, AI and real-time monitoring—visitors receive more engaging, educational and convenient experiences that cater to their ever-evolving needs.
Given these points, a standout example is The Strong Museum of Play used Mapsted’s Interactive Maps and Location Analytics to improve visitor experiences. Using this beacon-free approach, the museum has reduced maintenance costs and improved navigation, increasing visitor satisfaction. Real-time heat maps identified crowd hotspots, improving staff and exhibit placement.
A standout example is The Strong Museum of Play used Mapsted’s Interactive Maps and Location Analytics to improve visitor experiences.
Conclusion
Data analytics is essential for museums to understand visitors in 2025. With rising demand of adults visiting a museum last year—and shrinking attention spans, institutions need effective analytics to engage audiences. Mapsted’s Interactive Maps, IoT Devices and Location Analytics are perfect examples of how museums use data to understand visitors.
These patented technologies help museums ethically collect and interpret real-time data, improve exhibits and personalize interactions. Data privacy, transparency and the ability to re-identify anonymized data are also crucial to making visitors feel comfortable sharing information.
Key Takeaways
AI-driven curation, advanced analytics and next-level visitor flow tracking will help museums create inclusive, memorable cultural experiences. As a result, museums can create unforgettable experiences for a diverse and growing audience by focusing on art and data. If you found this blog helpful, don’t miss our blog post on Technology for Museums is Gaining Momentum: How Can It Work for Your Venue? or watch our video on Maximize Engagement at Your Museum or Gallery With Location-Based Technology to learn more.
Frequently Asked Questions
Q1. How can museums start collecting data about visitor behaviour?
Ans. Museums often begin with easily implemented methods such as Wi-Fi analytics, RFID wristbands or barcode systems. Mapsted’s IoT Flow Heat Mapping offers real-time visibility into where crowds form and how visitors move, so staff can adjust exhibit placement or manage lines. For a broader perspective, many museums supplement this anonymous tracking with surveys, focus groups and social media sentiment analysis. Prioritizing ethical considerations—by informing visitors about data collection practices and offering opt-outs—helps build trust and encourages community cooperation.
Q2. What ethical considerations should museums keep in mind when using data analytics?
Ans. Informed consent and transparency are key. Museums must explain data collection, storage and access. GDPR-compliant tools like Mapsted’s anonymize visitor tracking to protect privacy. To avoid re-identifying personal data, museums should collect only what they need to improve their experiences and conduct regular audits. Through strong data governance, museums can use analytics while respecting individual rights.
Q3. Q3. When should museums consider AI-driven technologies for deeper insights?
Ans. Museums benefit from AI once they’ve compiled sufficient, high-quality data and have a clear strategy. AI excels at pattern recognition—like clustering visitors by shared interests or predicting attendance based on historical trends. Integrating Mapsted’s Location Analytics can feed consistent, real-time information into these AI models. Before deploying AI, staff training is essential so employees can interpret results accurately and translate findings into actionable improvements. Well-prepared institutions can use AI for everything from curation to operations, adding a new layer of efficiency and engagement.
Q4. What are some practical applications of visitor flow tracking in museums?
Ans. Museum visitor flow tracking identifies congestion points, unvisited areas and underused exhibits. IoT Tags from Mapsted can track vital artifacts and ensure their location and timing. With real-time dashboards, museums can quickly add staff or adjust signage to handle traffic surges. These patterns inform strategic gallery remodelling, guided tour scheduling and targeted marketing campaign decisions over time. Every visitor has a better, more engaging experience.
Q5. How do museums measure the success of data analytics initiatives?
Ans. Success is measured by visitor satisfaction, dwell time and membership renewals. Positive social media comments and staff experiences can also confirm improvements. Integrations with Mapsted solutions link exhibit popularity to marketing performance, showing which campaigns work. Continued attendance growth, better event turnout and high post-visit ratings indicate that data-driven changes are improving the museum experience. Institutions improve strategies and momentum with regular reviews.
Q6. When should museums use AI?
Ans. Museums should adopt AI after collecting enough data. AI tools analyze visitor trends, improve exhibit layouts and predict attendance patterns.
Q7. How does visitor flow tracking help?
Ans. Flow tracking identifies crowded areas and underused exhibits. Tools like Mapsted’s real-time analytics improve layouts and visitor experience.
Q8. How do museums measure success?
Ans. Metrics include visitor satisfaction, dwell time, attendance growth and social media feedback. Mapsted tools link visitor behaviour to marketing and exhibit performance.


