


Trade Shows & Exhibitions
An accurate trade show foot-traffic count can be the difference between a potential exhibitor agreeing to spend their marketing dollars with you or at another event. Find out how to use the latest heat mapping in trade shows to get the most accurate traffic counts, optimize flow and create a better trade show experience for your exhibitors.
Overview: Heat Mapping in Trade Shows – Optimizing Events with Smart Data
In today’s competitive exhibition landscape, heatmapping in trade shows is a game-changer. It helps organizers and exhibitors visualize foot traffic patterns in real time and identify high-traffic zones. By leveraging heat map data, event planners can optimize booth placements, manage crowd flow and provide accurate post-show reports.
Beyond simple counts, heatmaps show what attendees engaged with, how long they lingered and where bottlenecks occurred. This powerful location intelligence boosts exhibitor ROI and improves event experiences. This article explores how heatmapping transforms trade show planning and performance analysis.
When you talk to potential exhibitors about your trade show, one of the first questions they’ll most likely ask you is about location analytics. Specifically, they’ll want to know about your show’s demographics and foot traffic.

Why Does Foot Traffic Matter?
And after a trade show, foot traffic is also metric exhibitors use to measure the success of the show. If there is a lot of foot traffic – even if it isn’t to their exhibit – they may consider exhibiting again. But if they don’t see the numbers, they know their time should probably be spent elsewhere.


An accurate measure of foot traffic is not only important to exhibitors but to trade show hosts as well. Relying on hand counters at entrances or on ticket check-ins and ticket sales only provides a rough estimate of the numbers. Plus, these methods are outdated. What’s the most accurate way to measure traffic at your trade show? Heat map analysis.
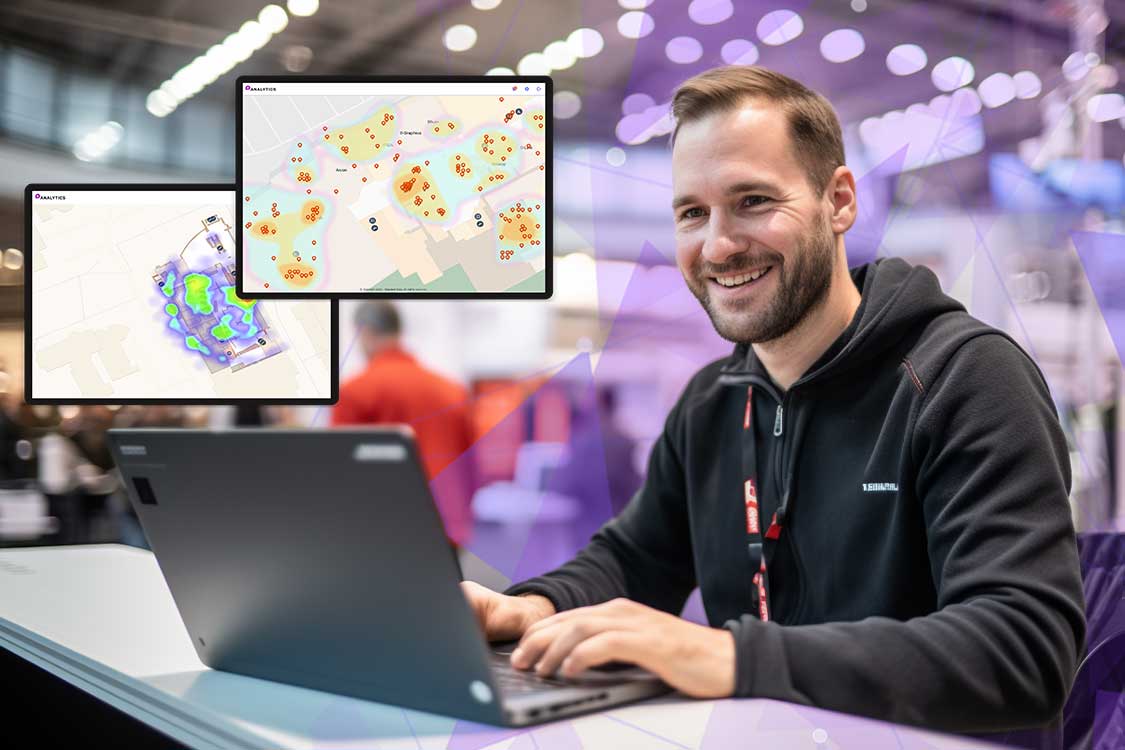
Heat Map Analysis for Trade Shows – What Does a Heat Map Show?
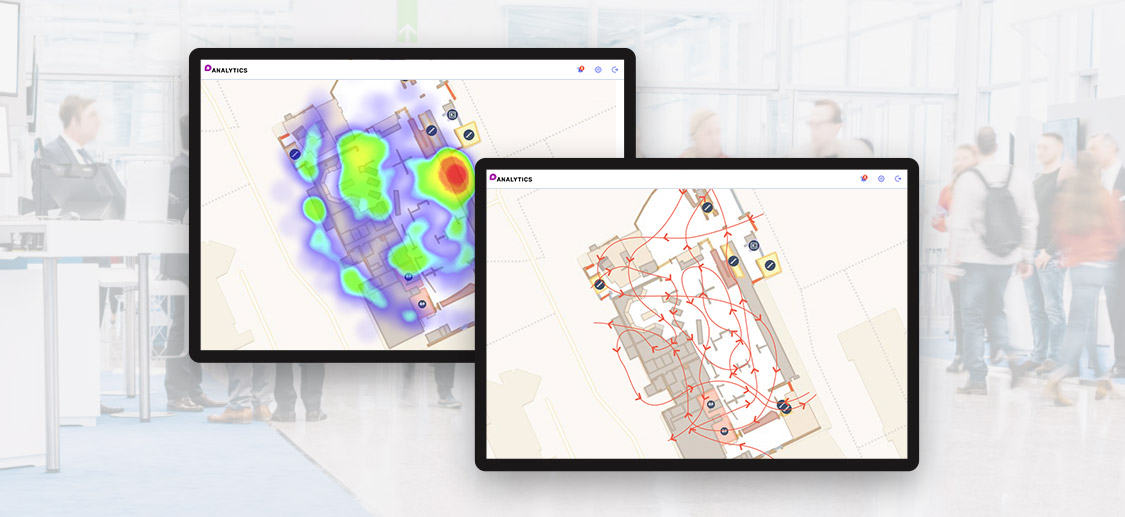
A heat map is a graphical representation of traffic flow and volume during a trade show. Different colours are used to represent the data, with darker shades of each colour representing larger values, and lighter shades representing smaller ones.
During your trade show, areas visited by the most people would appear in dark red and the areas that nobody visited would not show any colour.
Heat Maps and Traffic Patterns
In addition to telling you where attendees gather, heat map analysis will also show you how they moved within the venue. Map colours correspond to the traffic during a particular time period. For example, red areas typically represent the most-visited areas, while green spots represent lower traffic.
Additionally, heat map analysis for trade shows can reveal how long people stay in particular areas. This lets you know what exhibits your visitors are most interested in. Data can be analyzed hour-by-hour to see how traffic changes throughout the day. It also helps event planners learn what areas are most valuable. With data on traffic patterns, it’s easy to identify areas for which exhibitors would pay a premium.
Providing exhibitors with accurate foot traffic information helps them to justify booking your show again. Mapsted’s location analytics tool features heat map analysis for trade shows to streamline the task and provide excellent accuracy.
For more information on location-based technology, check out these blogs: What Is Location Intelligence and How Can It Be Used in Business?.
Frequently Asked Questions
Q1: What can heat map analysis tell you?
A: A heat map is a simple two-dimensional data visualization tool. It depicts populated areas in warmer tones, while less crowded space is depicted in cooler colors. Using a heat map is a great way to track trade show floor activities over time and deduce patterns.
Q2: What is the best tool for heat map analysis?
A: Mapsted Analytics is the best heat map analysis tool on the market. It offers all tools you will need to analyze your attendee traffic flow.
Q3: Why not use Google Maps for heat map analysis?
A: Google Maps is a useful tool for outdoor navigation, but not for indoor visitor activities. It does not provide more accurate data than other standalone heat map analysis tools. This is one of the factors that leads businesses to seek Mapsted analytics solutions.
Q4: What is heatmapping in trade shows and why is it important?
A: Heatmapping in trade shows is a location analytics technique that visualises attendee movement and dwell time using a colour-coded footfall heatmap. It’s important because it provides real-time insights into visitor engagement, helping organisers optimise booth placement, traffic flow and exhibitor ROI.
Q5. How can a foot traffic heat map improve exhibitor satisfaction?
Ans. A foot traffic heat map offers data-driven insights into how many attendees visited each zone, how long they stayed and what attracted their attention. Sharing this data with exhibitors demonstrates the value of their investment and helps justify future participation.
Q6. What technology is used to create footfall heatmaps at trade shows?
Ans. Advanced technology for heat mapping includes indoor positioning systems, sensor fusion and AI-powered analytics. Platforms like Mapsted’s hardware-free solution offer precise attendee tracking without relying on Wi-Fi, beacons or Bluetooth, making setup seamless and cost-effective.
Q7. Can heatmaps be used to predict trade show traffic patterns?
Ans. Yes. Predictive heat maps analyse historical visitor data to forecast crowd movement and peak times. This allows organisers to proactively manage floor layouts, reduce congestion and improve attendee experience during future events.
Q8. What kind of insights does heatmapping provide post-event?
Ans. Post-event, heatmapping in trade shows helps identify high-traffic zones, underutilised spaces, engagement levels at booths and peak visitation periods. These insights contribute to better floor planning, pricing strategies and marketing for future trade shows.
Q9. How accurate is heat mapping technology for exhibitions?
Ans. Modern technology heat map tools like Mapsted provide high-precision location data with one-metre accuracy. This means organisers get reliable insights without manual error or estimation, unlike traditional footfall counters.
Q10. How does heatmapping enhance ROI for trade show organisers?
Ans. Heatmapping boosts ROI by offering transparent, measurable data about visitor behaviour. Organisers can use this information to price premium booth zones, tailor marketing strategies and improve traffic distribution across the venue.
Q11. What is the difference between a heatmap and a traffic counter?
Ans. While an exhibition foot traffic counter simply logs entry or exit numbers, a footfall heatmap visually tracks movement throughout the venue. It adds depth by showing where, when and how attendees interact with spaces, offering far more actionable insights.


