


IoT Solutions
Managing physical spaces — a retail store, an office or a big event venue — has always been a challenge. How do you know which areas are the busiest, where people are going and where to make improvements? Until now, businesses had to guess or rely on manual observations, which rarely gave the full picture. But things have changed. Today, technology allows for a more accurate, data-driven approach to how people interact with physical spaces.
This is where heat map visualization comes into its own. Heat map data visualization provides a clear, visual representation of movement and activity in a space that helps businesses better understand the way their space is used and optimize their operations. Heat maps are useful in all kinds of ways, whether it’s about improving customer experience, making foot traffic smoother or optimizing operational efficiency.
Before we get into how advanced heat map tools can change the game when it comes to space management, we’ll look at what heat map visualization is and what the common options are.
What is Heat map Visualization, Why Does It Matter, Common Alternatives?
What if you could see a colour-coded map of where people are within your space, how long they stay and which paths they use the most? In essence, that’s what heat map in data visualization does. Warmer colours (red and orange) represent higher traffic areas, while cooler colours (blue and green) indicate less active spaces to visualize movement data.
So why does this matter? That’s because when you can see how people are using your space, you can make better decisions. For example, in retail, you can figure out where to place key products. You can optimize the flow of passengers to ensure bottlenecks don’t happen at airports. Heat maps remove the guesswork from managing physical spaces.
Simplifying Complex Data
Without heat maps, collecting this type of information requires manual analysis of vast data.
Imagine how many people’s feet touch the floor of a store or venue daily. It would be practically impossible to go through such data without the help of some tools.
Using heat maps in data visualization helps to address this issue. It provides you with a simple, straightforward way of seeing movement in real time. A heat map pinpoints which zones require action. It prevents you from getting lost in data or spending hours watching security camera recordings.
Common Alternatives for Heat Map Visualization
While heat map technology is relatively new, several approaches have been used to track movement in physical spaces:
- Video Analytics: This method applies the use of cameras to monitor the movement in real time. Despite its effectiveness, video analytics raise high privacy concerns because they involve capturing and analyzing people’s movements through videos. Also, video solutions are more complex and need more support infrastructure, which can be expensive.
- Sensor-Based Tracking: Infrared or pressure-sensitive floor mats, for example, use movement or pressure to count people entering or exiting a space. These methods can be quite reliable but they need a lot of hardware investment and constant maintenance.
- Bluetooth Beacons and RFID: These systems employ beacons or tags to track people who have agreed to be tracked. While this method can give accurate data, it is more intrusive since the visitors have to hold or wear a device.
- IoT Solutions That Detect WiFi Signals Are a Better Fit: IoT solutions working on WiFi signals like Mapsted Flow are more effective than traditional ones because they do not need additional hardware and make use of existing visitor devices like smartphones and watches. The signals are already available in most environments, which means that the integration will be easier and cheaper. In addition, it works great for areas with limited power access through its innovative 72-hour rechargeable battery.
Additionally, unlike video analytics, heat map analytics gained from WiFI signals does not entail storing or capturing people’s images, which is more appropriate.
Now that we’ve discussed the options let’s see how Mapsted Flow enhances heat map visualization.
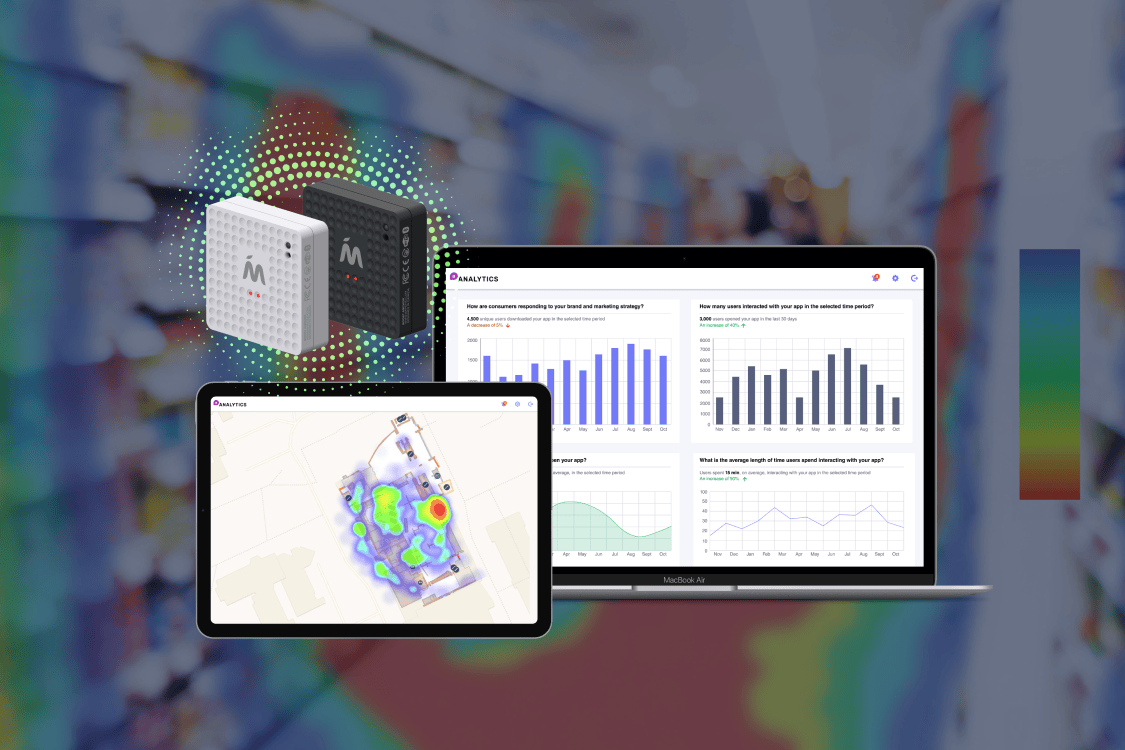
What is Mapsted Flow?
Mapsted Flow is a real-time location heat map generator that can be used in any kind of environment. Shopping complexes, airports and companies use it to learn how individuals engage with space. What sets Mapsted Flow apart from other solutions is that it doesn’t use cameras or applications to obtain data. However, it employs Wi-Fi signals, so people do not have to sign up and their privacy is not violated in any way.
One Mapsted Flow device can support up to 5,000 square feet and the system operates in locations with restricted power sources due to the 72-hour battery backup. Whether you own a small shop or are responsible for an entire campus, Mapsted Flow can show you how your space is being utilized.
Key Benefits of Mapsted Flow’s Heat Map Visualization
Now that you know what heat maps are and how Mapsted Flow works, let’s discuss how this technology is useful for businesses and their applications. Mapsted Flow offers valuable information that can revolutionize how companies organize their spaces, personnel and processes.
1. Optimizing Traffic Flow with Real-Time Insights
The biggest challenge in managing any space is ensuring smooth movement. It is essential to manage foot traffic during a big sale at a store. Airports handle it during peak travel times.
Real-time data from Mapsted Flow shows where crowds are forming and businesses can act immediately. For example, in a busy retail environment, if aisles are becoming congested, you can rearrange displays or open additional checkout lanes to relieve the pressure. It’s the same at airports, where directing passengers to less busy security lines can help make the experience smoother and faster.
And this is just one aspect. You can use the same technology to prevent bottlenecks and maximize space usage in transportation hubs, large event venues and corporate offices.
2. Improving Customer Experience with Data-Driven Decisions
Mapsted Flow does more than just manage traffic, it allows you to make decisions that will improve your customers’ experience. Through the data, you can see which sections visitors spend the most time in, where they pause and what they tend to avoid.
For example, in retail, heat map analytics can show where customers spend the most time. Businesses can move high-interest products into those locations or place promotional materials where they will have the most impact. Service industries like healthcare can direct patients more efficiently, reducing wait times and increasing satisfaction.
Here, the key is actionable insights. You’re not just seeing data for data’s sake. You’re using it to make concrete, helpful changes to improve the overall visitor experience.
3. Enhancing Safety and Security
Managing the crowd outflow is not only for their comfort. This is also for their safety. In an environment that is full of people, the chances of getting injuries or even security problems increase. Understanding the trends of people and their concentration at certain places has assisted enterprises in mitigating these risks.
Mapsted Flow can point out where the areas of high density are in real time so that the businesses can take action before the situation rises to worse tides. This is essential, especially for large venues like event halls or large shopping places where crowd flow monitoring is paramount. Even at the time of exit, guides can use the live information to help people escape through the best exits faster than before.
Industries Benefiting from Mapsted Flow’s Heat Map Visualization
We’ve touched on some examples already, but let’s dig deeper into the industries that stand to gain the most from Mapsted Flow’s heat map technology.
1. Retail Spaces
Understanding customer behaviour is one of the most important things for retailers to increase sales. Heat maps help store owners see where customers first go, how long they spend in various parts of the store and which parts of the store they ignore. You can use this data to optimize store layouts, place high-margin products in high-traffic areas and plan better promotional displays.
For example, if a part of the store is seeing more traffic, mall owners may charge higher rent for that area. You can reevaluate poor-performing sections to promote more interaction.
As per research data, shopping mall traffic is growing by 10.4% YoY. Such data can be a goldmine for mall owners and operators.
2. Healthcare Facilities
Mapsted Flow can help hospitals and clinics improve patient flow. By knowing where patients and visitors are congregating, healthcare providers can allocate staff more effectively, reduce wait times and ensure patients are seen promptly. Real-time data can inform staff when a waiting room is getting too full, allowing them to redirect patients to other available areas.
Such insight has the potential to result in better patient outcomes and also better healthcare service delivery.
3. Transportation Hubs
Airports and other transit stations face similar challenges, with thousands of people passing through them daily. Mapsted Flow helps these facilities manage passenger flow by providing real-time information on where bottlenecks are forming. This means smoother security processing, fewer delays at boarding gates and a more comfortable travel experience for passengers.
Especially for airports, efficient crowd management results in lesser anxiety levels of the passengers while sales and exposure of the businesses present at the terminals advance.
4. Corporate Offices
Many corporate offices are becoming more flexible and adopting hybrid work schedules. In other words, it’s more important than ever to understand how employees use office space. Businesses can use heat map data visualization to find out which areas are not being utilized enough and make better decisions about space allocation. For example, businesses can redistribute resources more efficiently if certain meeting rooms are always occupied and others are always empty.
Over the long haul, this could mean better productivity as well as a more efficient use of office space.
5. Event Venues
Crowd management is a top priority for large event venues. Organizers use heat maps to see how people move through the venue, find choke points and then adjust staffing or signage accordingly. It not only improves the attendee experience but also helps follow safety protocols.
Mapsted Flow provides the data needed to stay on top of things, even during high-capacity events, from sports arenas to concert halls.
Advanced Features of Mapsted Flow’s Heat Map Visualization
Mapsted Flow is not just about showing you where people are—it’s a full space management tool with advanced features.
1. People Counting Insights
This is one standout feature: being able to count people in real time. Mapsted Flow monitors the number of people in different areas and gives crowd density metrics. Managing spaces with occupancy limits—such as stores, airports and entertainment venues where overcrowding can be a safety issue—requires this.
This information lets you know exactly how many people are in any given area, adjust staffing, close off areas or automatically send out notifications to direct people elsewhere.
2. Dwell Time Analytics
Dwell time analytics is another impactful function. This shows you where people spend the most time, focus their attention and interact the most with a product or service. In retail, this can be quite beneficial. After all, if you know which displays get the most attention, you can depend on that information to rearrange your store and figure out which promotions to embrace.
For Corporate offices, it helps in creating office spaces that encourage employees to be productive by identifying their preferred work environments.
3. Customizable Data Views for Operational Planning
Mapsted Flow provides businesses with the ability to customize how they see their data. This flexibility allows you to customize the heat map to suit your needs, focusing on specific areas or time frames. Whether you’re looking at foot traffic across an entire building or just one sector, the system adjusts to show you the insights you need.
Case Study: Kaseya Center’s Success with Mapsted Flow
The Kaseya Center, home of the Miami Heat, provides a great example of how Mapsted Flow improves crowd movement. The organizers were trying to better manage crowd movement at games and events in the stadium. The venue is in a city that is home to thousands of fans moving in and out of the venue, so optimizing foot traffic was crucial for both fan experience and safety.
With Mapsted Flow, the stadium management team was able to monitor real-time crowd data and make decisions on the fly about concession stand placement, staffing and floor plans.
Revenue Boost and Operational Improvements
The Kaseya Center was able to increase projected concession sales by 15% because of Mapsted Flow. They were able to maximize sales by placing the most needed items in areas where there was a higher concentration of fans, which reduced customer congestion. Additionally, changes in the layout of the center improved the overall experience. Real-time heat map analytics shows its effectiveness in tracking movement.
How Mapsted Flow Ensures Privacy Compliance
Mapsted Flow provides all this information without violating people’s privacy. Unlike many tools that use cameras or require opt-ins, Mapsted Flow collects non-identifiable information via Wi-Fi. It does not record personal details, while businesses still receive relevant real-time data.
No Cameras, No Personal Data
This strategy allows accurate space usage metrics without bothering visitors. Mapsted Flow does not require cameras, apps or personal devices for tracking. It ranks among the best heat map tools for meeting privacy requirements.
Why Mapsted Flow is the Future of Space Management
Businesses are increasingly turning to heat maps as a powerful tool for figuring out how to best use their physical spaces. Mapsted Flow leads the way by offering a powerful, privacy-friendly solution that provides real-time actionable data without using invasive technologies. Mapsted Flow can be used by retailers, healthcare facilities, corporate offices, event venues or anywhere else businesses operate.
Book a Demo to See How Mapsted Flow Can Help
Would you like to see what Mapsted Flow can do for your business? Book a demo today and discover how heat map visualization can help you optimize your space, elevate customer experience and grow your bottom line. If you found this blog helpful, don’t miss our blog post on How Heat Mapping Can Help Your Business? or watch our video on Discover Unparalleled Building Visibility with Real-Time Anonymous Heat Mapping to learn more.
Frequently Asked Questions
Q1. How does Mapsted Flow collect data for heat maps?
Ans. Mapsted flow uses Wi-Fi signals to follow movement in a space without the need to identify people. Unlike other applications, it does not necessarily involve the use of cameras and also collection of personal information.
Q2. Do visitors need to install an app or wear a device for Mapsted Flow to work?
Ans. Absolutely not, visitors do not have to download anything or wear equipment.
The system, called Mapsted Flow, integrates with an organization’s Wi-Fi networks without requiring additional installations for visitors.
Q3. Can Mapsted Flow be used in areas with limited power?
Ans. Indeed, the Mapsted Flow devices feature a 72-hour battery, allowing them to be used in zones with no or low-power ventilation.
Q4. What industries can benefit from using Mapsted Flow?
Ans. Mapsted Flow’s heat maps provide real-time data for various facilities like retail stores and hospitals. Corporate offices, transportation hubs and event spaces can also benefit from this real-time information.
Q5. Is the data collected by Mapsted Flow GDPR-compliant?
Ans. Of course, Mapsted Flow securely collects data without violating GDPR and other similar regulations.


